Making Interactive maps in Python using GeoJSON and GitHub
 Ancient DNA metagenomic sample interactive map
Recently, I’ve been involved with the AncientMetagenomeDir project. Briefly, with this collaborative community effort, we aimed to regroup in one single repository, all the metadata about every single published ancient DNA metagenomics article, and turn them into FAIR scientific data.
We ended with large TSV (table) files regrouping a standardized set of metadata, about each ancient DNA metagenomics sample. Because these are originally archeological data, one of the information that is systematically collected is the geographical location of each sample.
While static maps were already generated for the AncientMegenomeDir publication, we had the opportunity to play with interactive maps for the website of the project.
Usually, hosting interactive elements online require some sort of backend framework (like Streamlit or Shiny) to perform the rendering, however, I wanted to have it as serverless as possible, and this is where the GeoJSON rendering function of GitHub came to the rescue.
Using GitHub magic, that meant that as long as I would push a GeoJSON file on GitHub, it would automatically be rendered as an interactive map, thanks to Leaflet.js.
From TSV to GeoJSON
The question that I was left with: How to go from a TSV table to a GeoJSON file ?
Luckily for me, this is really easy to do thanks to GeoPandas.
I only needed to make sure that there were a latitude and longitude columns in the TSV files.
](/post/interactive-map-howto/coordinate-system_hu0fbc7a9d6e3ec1414817c2d1317b72fa_45308_e68793dd344fa7bdbd49fc64a155d63d.png)
import pandas as pd
import geopandas

df = pd.read_csv("table.tsv", sep="\t")
gdf = geopandas.GeoDataFrame(df, geometry=geopandas.points_from_xy(df.longitude, df.latitude))
gdf.to_file("output.geo.json", driver='GeoJSON')
Instead of pushing to GitHub at every change to check a GeoJSON rendering, you can check a GeoJSON map with the geojson.io website.
Displaying more metadata on the map
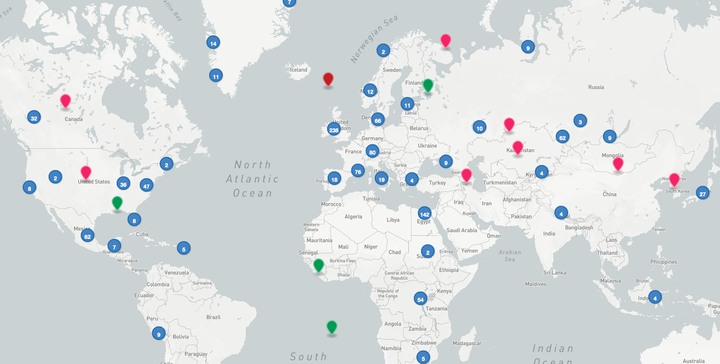
So far, I only used the map to display the latitude and longitude of each sample, but we can actually display more information by changing the color, size, or the shape of each marker(point) for example.
Refering again the Github documentation, this corresponds to the marker-color, marker-size, or marker-symbol.
For example, to change the color, we add a marker-color column with the desired color value.
| marker-color | publication_doi | site_name | latitude | longitude | sample_name | sample_age | material | archive | archive_accession |
|---|---|---|---|---|---|---|---|---|---|
| #009C54 | 10.1016/j.quascirev.2017.11.037 | Hässeldala Port | 56.16 | 15.01 | HA1.1 | 13900 | lake sediment | ENA | SRS2040659 |
| #C22026 | 10.3390/geosciences10070270 | Unknown | 53.322 | 1.118 | ELF001A_95_S81_ELFM1D1 | 6000 | shallow marine sediment | ENA | ERS3605424 |
Table 1: Sample data from the AncientMetagenomeDir repository
Here, markers in pink are host-associated single genomes, while markers in light-blue are host-associated metagenomes.
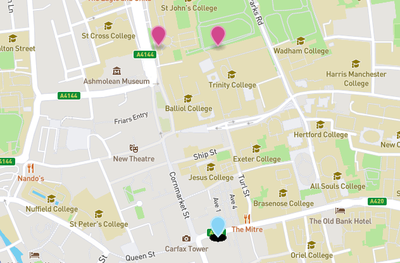
Preventing overlapping points
In this dataset, different samples are sometimes coming from a same archeological site. In practice, this means that points will overlap on the map because they share the exact same geographic coordinates. In Figure 2, for example, you can notice a very dark shadow bellow each marker: that’s because there are many overlapping markers present on the spot.
The problem is that only one marker will be displayed, and the other ones being hidden below.
To overcome this issue, the little trick is to slightly alter the coordinates of each sample to plot them as distinct points on the map. I did that with random sampling from the normal distribution using Numpy with a very small standard deviation.
import pandas as pd
import geopandas
import numpy as np

df = pd.read_csv("table.tsv", sep="\t")

sigma = 0.0015

df['new_latitude'] = df['latitude'].apply(lambda x: np.random.normal(x, sigma))
df['new_longitude'] = df['longitude'].apply(lambda x: np.random.normal(x, sigma))

gdf = geopandas.GeoDataFrame(df, geometry=geopandas.points_from_xy(df.new_longitude, df.new_latitude))

gdf.to_file("output.geo.json", driver='GeoJSON')
Problem solved !

End result
Finally, thanks to the magic of GitHub GeoJSON rendering, the map can be easily embedded on any web page !
This is an interactive map, you can click around and zoom to navigate.